Desktop
General Appearance
The layout of the main screen in the web interface differs from that of the mobile application. In the web version, the user interface is divided into two primary sections:
- Navigation Menu (Left Panel):
Located on the left side of the screen, the menu is organized into multiple tabs, providing quick access to various system sections such as Climate, Equipment, AI, Notes, Settings, and Help. Each tab expands to display a detailed submenu when selected.
- Information Display Panel (Right Panel):
The right side of the screen dynamically displays detailed information related to the selected tab. This includes real-time data from connected sensors, module status indicators, and device-specific information.
In contrast, the mobile application interface is optimized for smaller screens and follows a compact, vertically oriented layout. The tabbed menu is typically accessible via a bottom navigation bar, and the information display section is adapted for mobile-friendly viewing, ensuring readability and ease of interaction on touchscreen devices.
This separation of concerns between navigation and content display ensures a user-friendly and efficient experience across both platforms.
Climate
Sensors
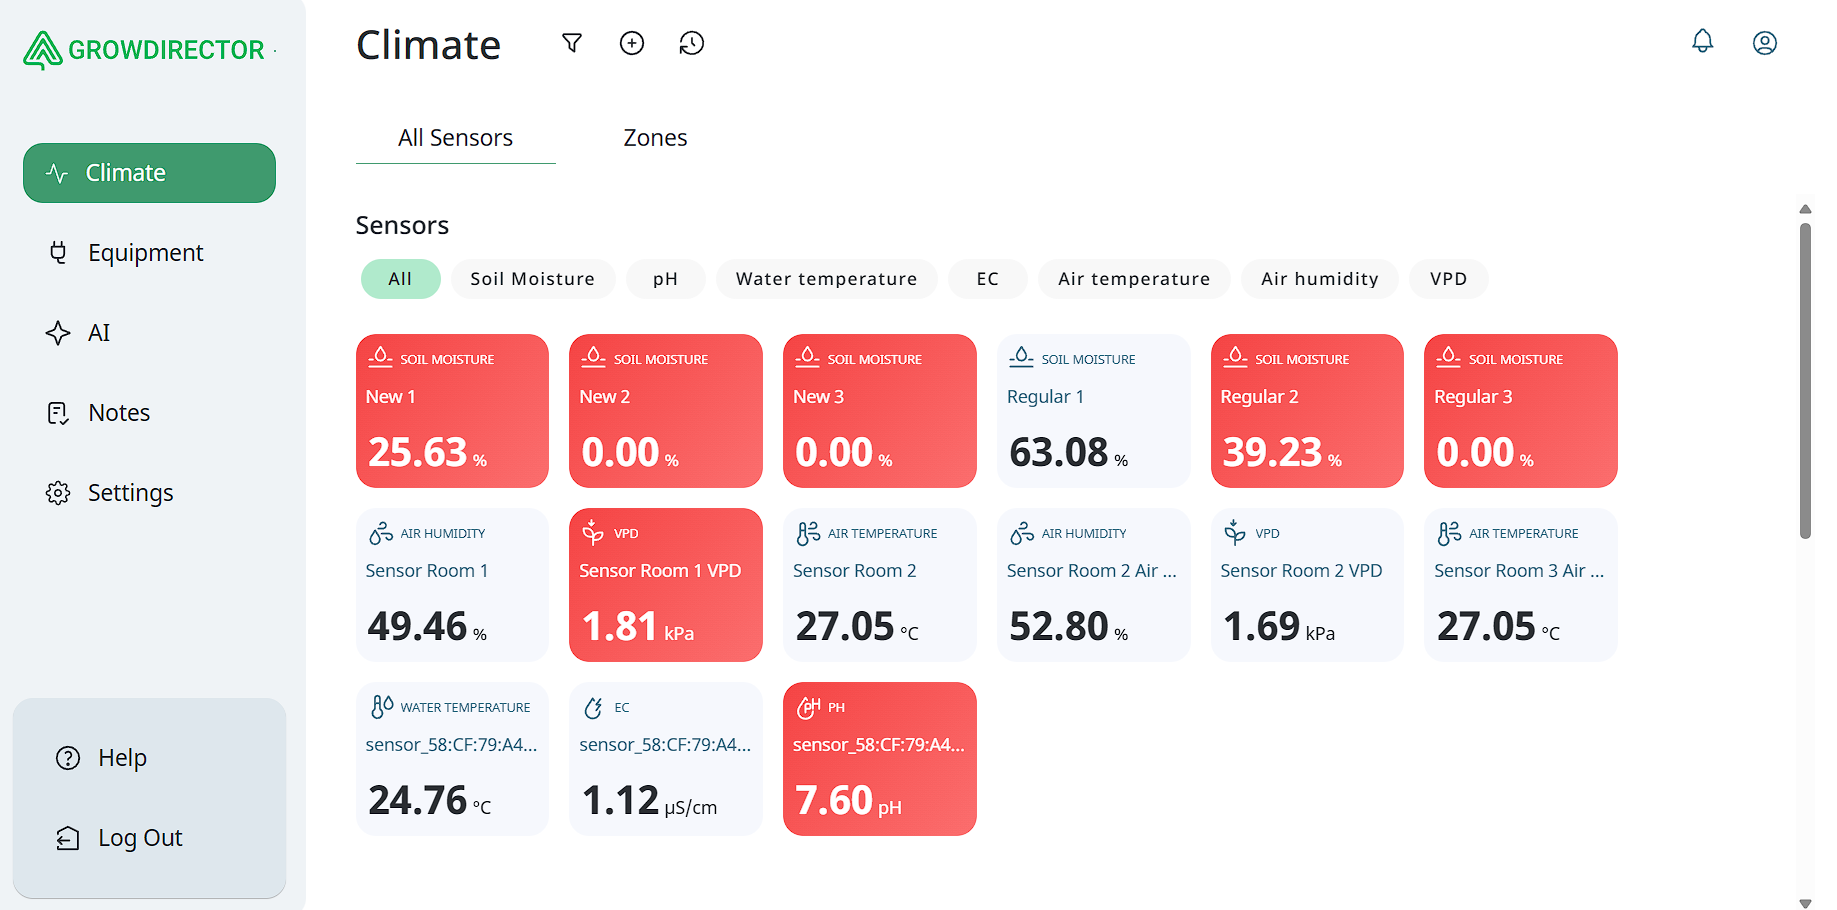
Accessing Sensor Display and Filtering Options
To view the list of sensors and their data, follow the steps below:
- Navigate to the “Climate” Tab:
In the left-hand navigation menu, select the Climate tab. This section contains information related to environmental monitoring sensors.
- Open the Sensor Overview Panel:
In the upper section of the right-hand panel, click the All Sensors button. This will open a dedicated window displaying an overview of all available sensors in the system.
- Sensor List and Filtering:
Within the opened window, all connected sensors are displayed automatically. You can filter the sensor list by type (e.g., temperature, humidity, CO₂, etc.) using the dropdown or filtering options provided.
- Graph Display and Sensor Selection:
Below the sensor list, real-time readings and historical data are visualized in a graph.
By default, data from all sensors is displayed on the graph. However, users may refine the view by selecting specific sensors for a more focused analysis.
This functionality allows for quick access to sensor data and supports customized filtering to assist in monitoring and diagnostics.

Zones
In the desktop version of the application, Zones are a specialized organizational feature located under the Climate tab. Zones provide a structured way to group sensors and devices based on their physical location or functional area within a given environment.
This feature is particularly useful for users managing multiple monitoring points or control units in complex setups, such as greenhouses with multiple sectionsor rooms, or industrial facilities with designated climate areas.
By assigning sensors and devices to specific Zones, users can:
-
Monitor environmental data more efficiently
-
Apply zone-specific automation or alerts
-
Simplify device management and maintenance
-
Improve visibility and control over large or segmented areas
Each Zone can be named and configured independently, allowing for flexible and intuitive mapping of the physical layout to the digital interface.

Adding zone
- To add a new Zone, click the corresponding Add Zone button located at the top of the screen within the Zones tab (under the Climate section).
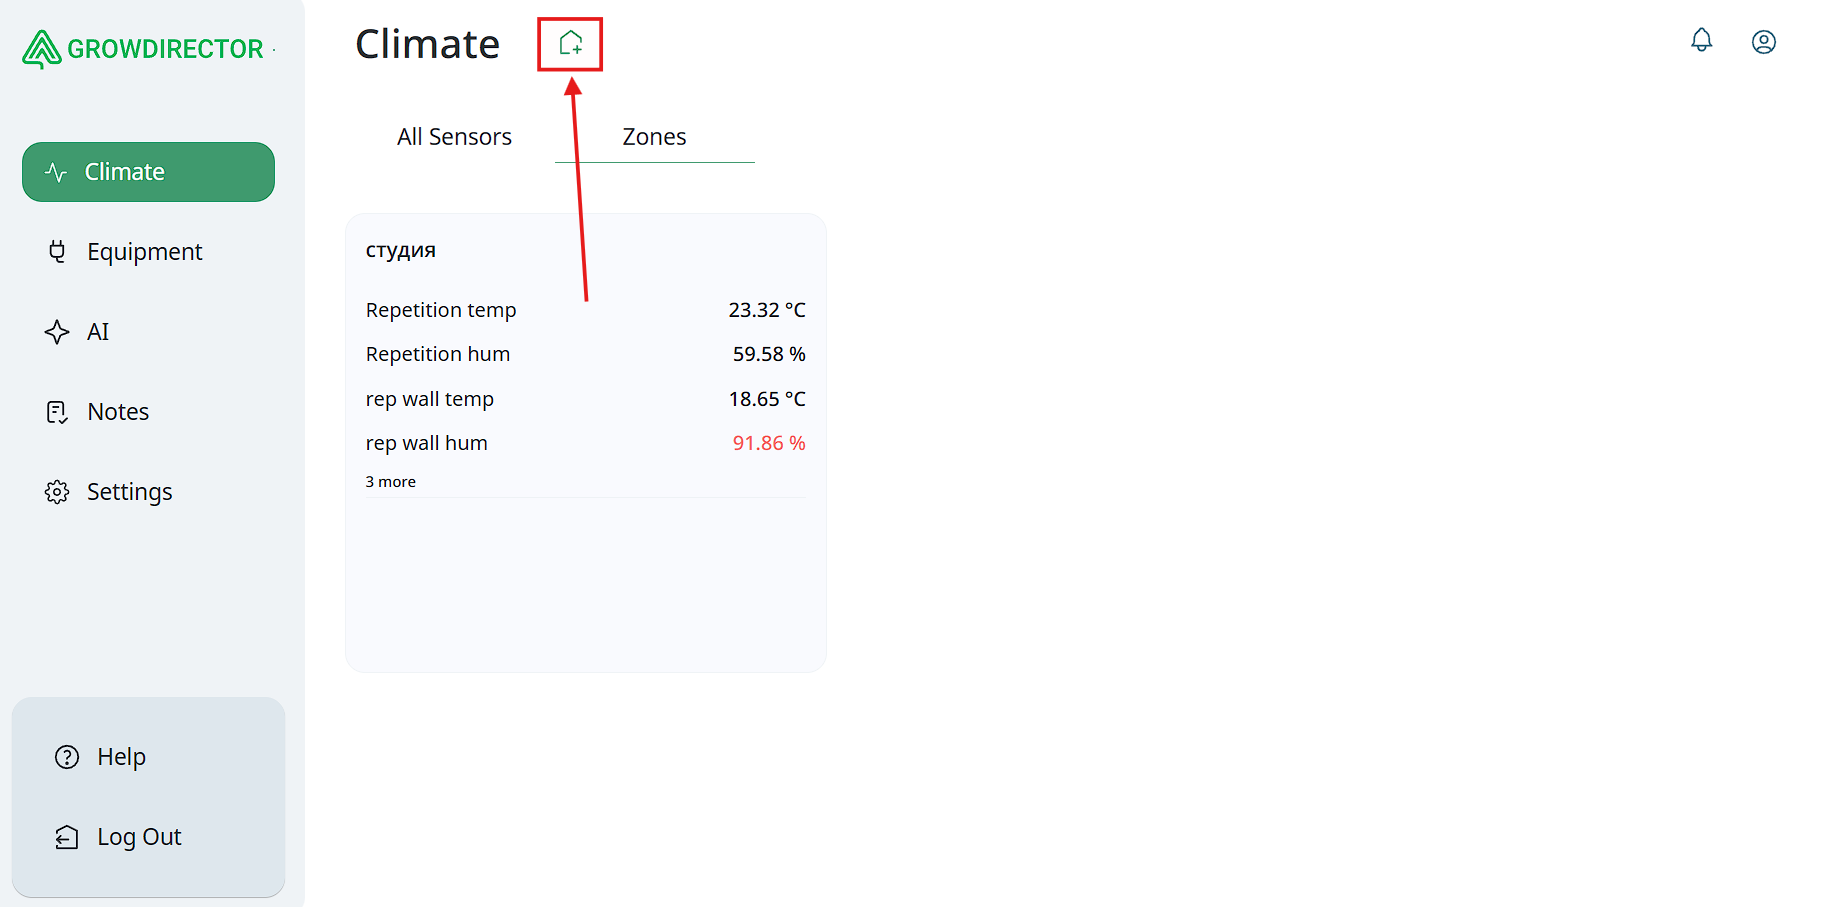
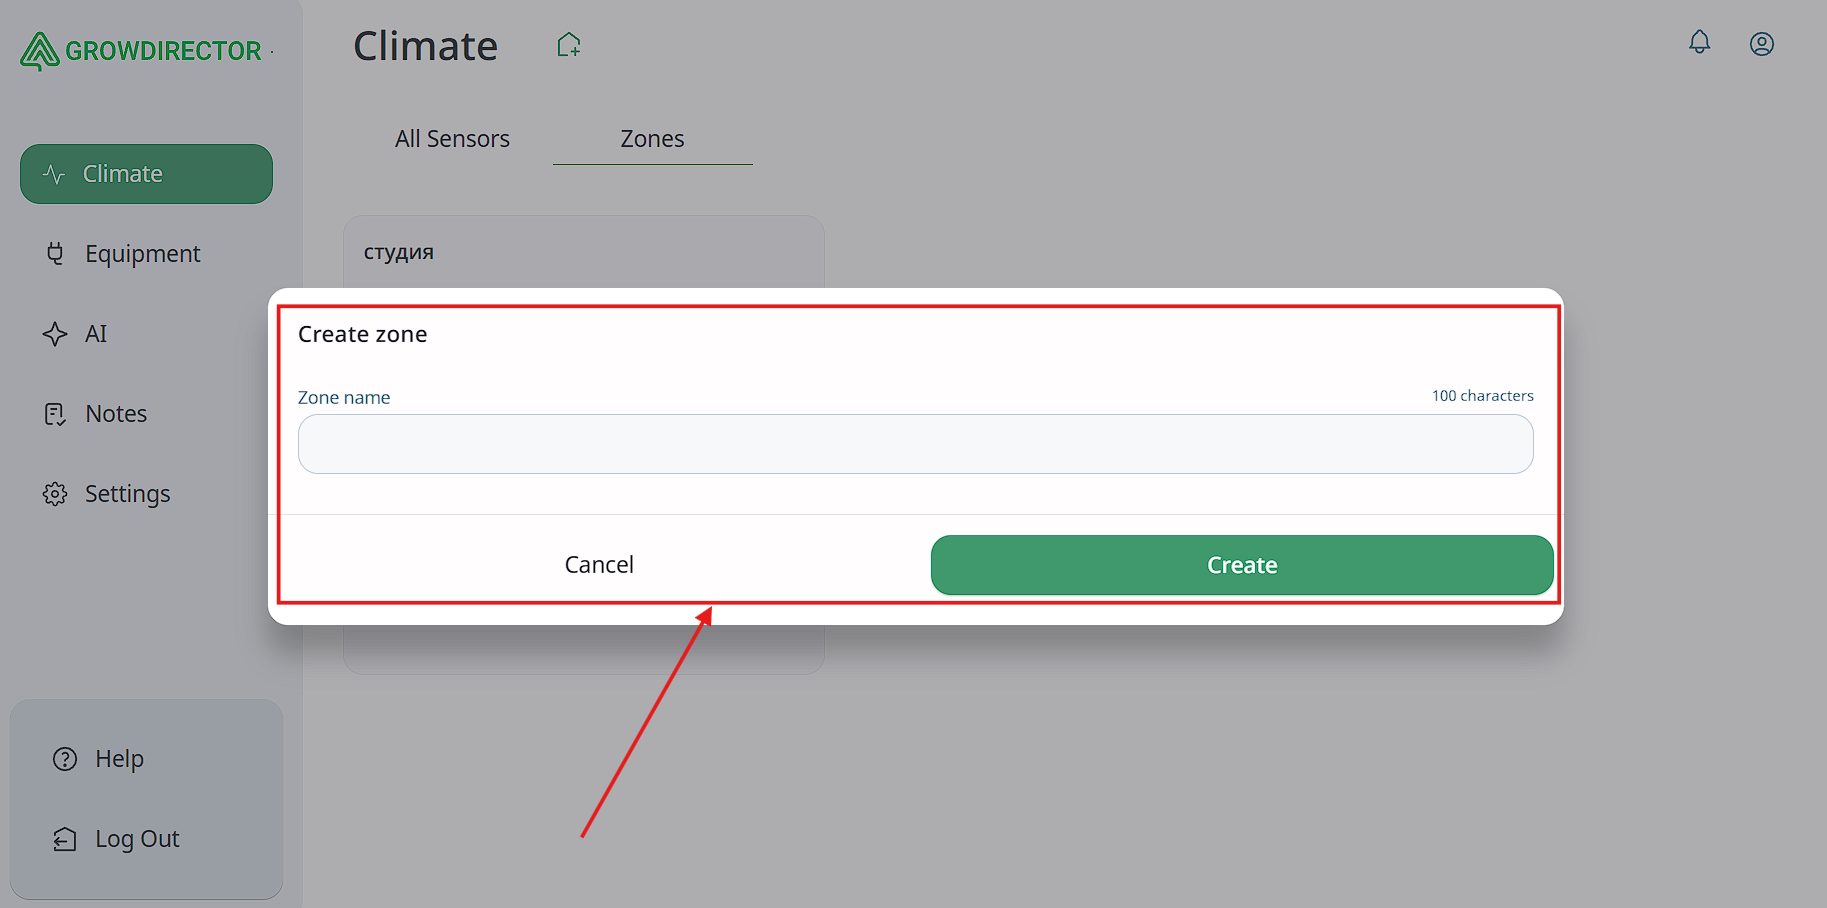
- Next, enter a name for the Zone and click the Create button. The newly created Zone will automatically appear in the Zones tab.
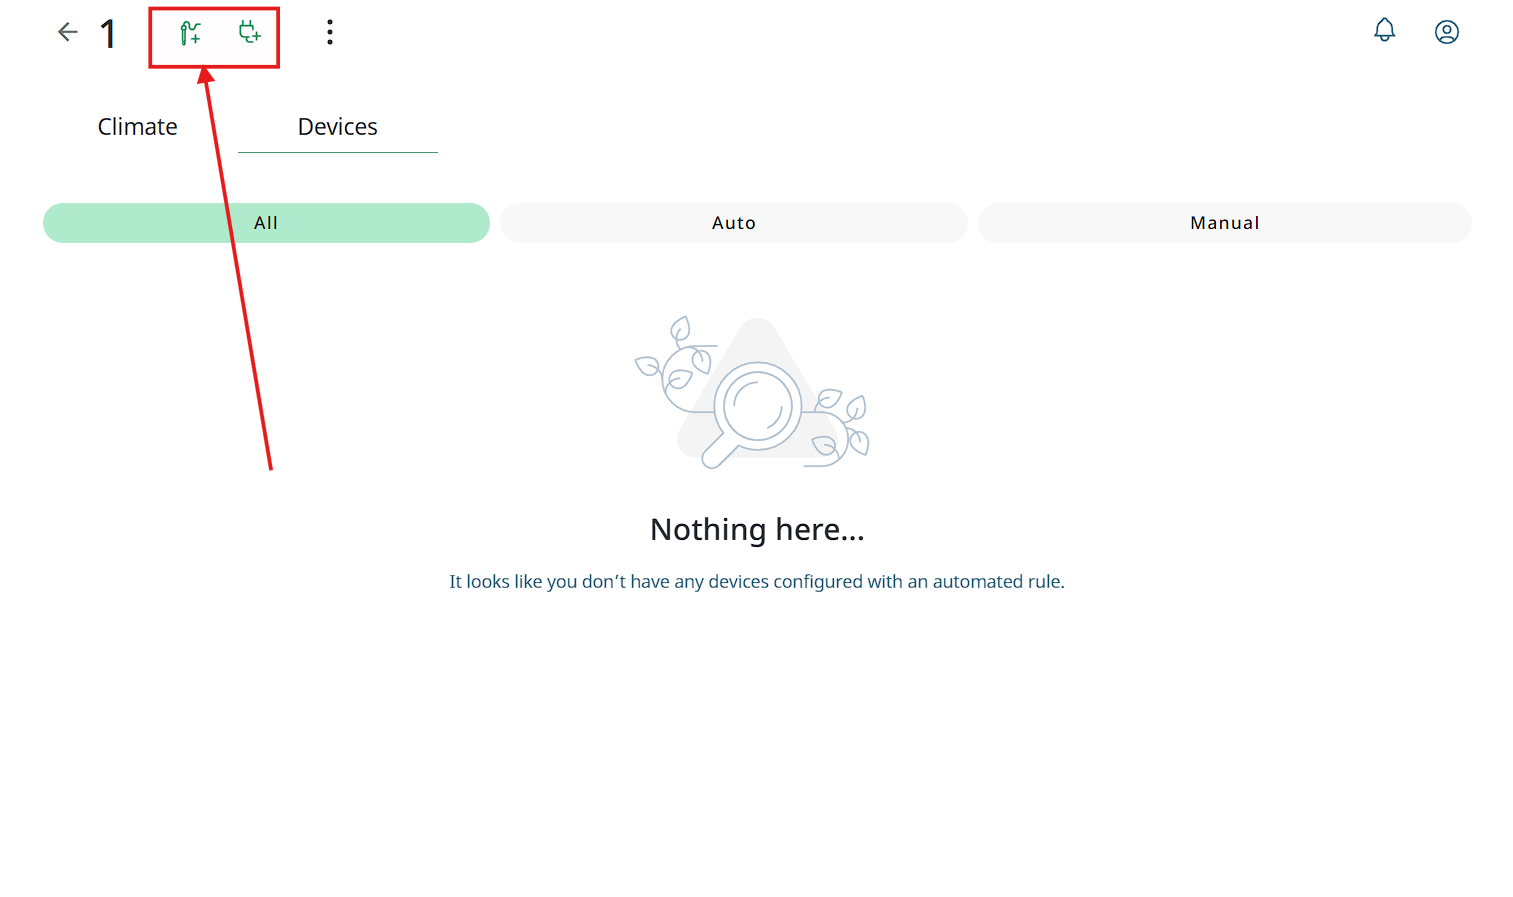
Adding sensors and devices to Zone
To add a sensor or device to a Zone, click one of the corresponding buttons located at the top of the screen next to the Zone name. Then, select the desired item from the list and confirm your selection.
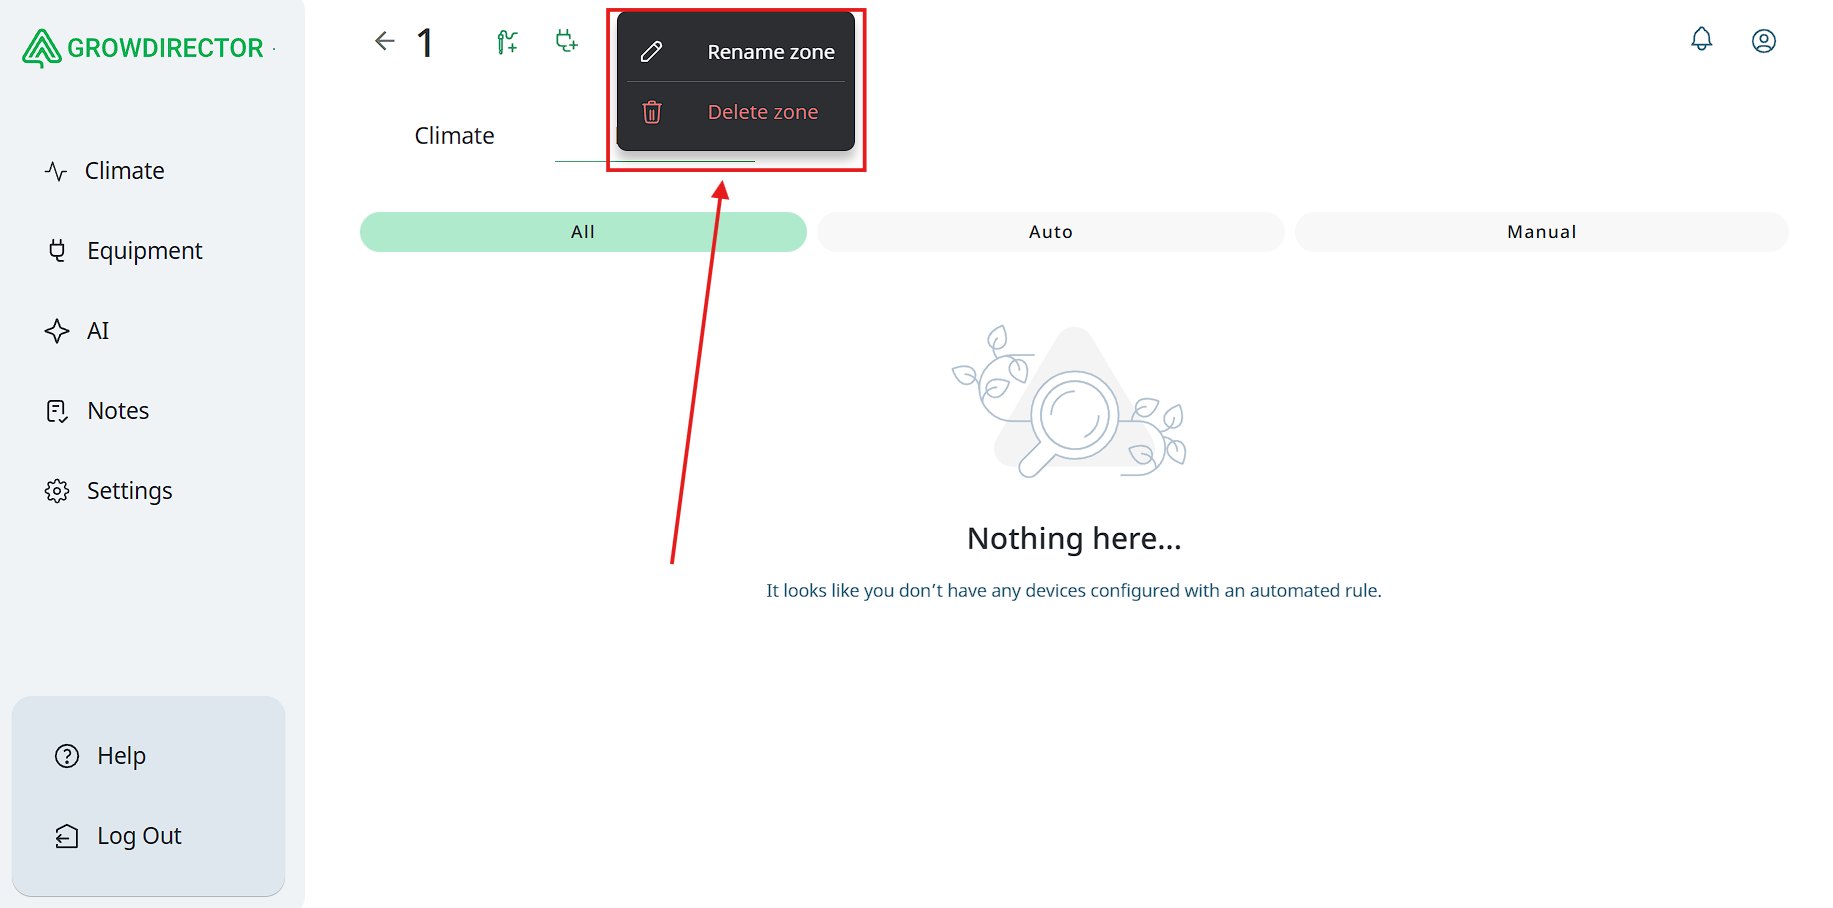
Deleting/Renaming Zone
To edit or delete a Zone, click the three-dot button located at the top of the screen. Then, select the desired option from the dropdown menu and confirm your choice.
Additional Buttons
The Climate screen also includes additional control buttons that enhance sensor management and data accessibility:
- Filter:
Opens a filtering panel that allows users to select specific sensors for display, regardless of their type. This enables tailored views based on user preferences or monitoring needs.
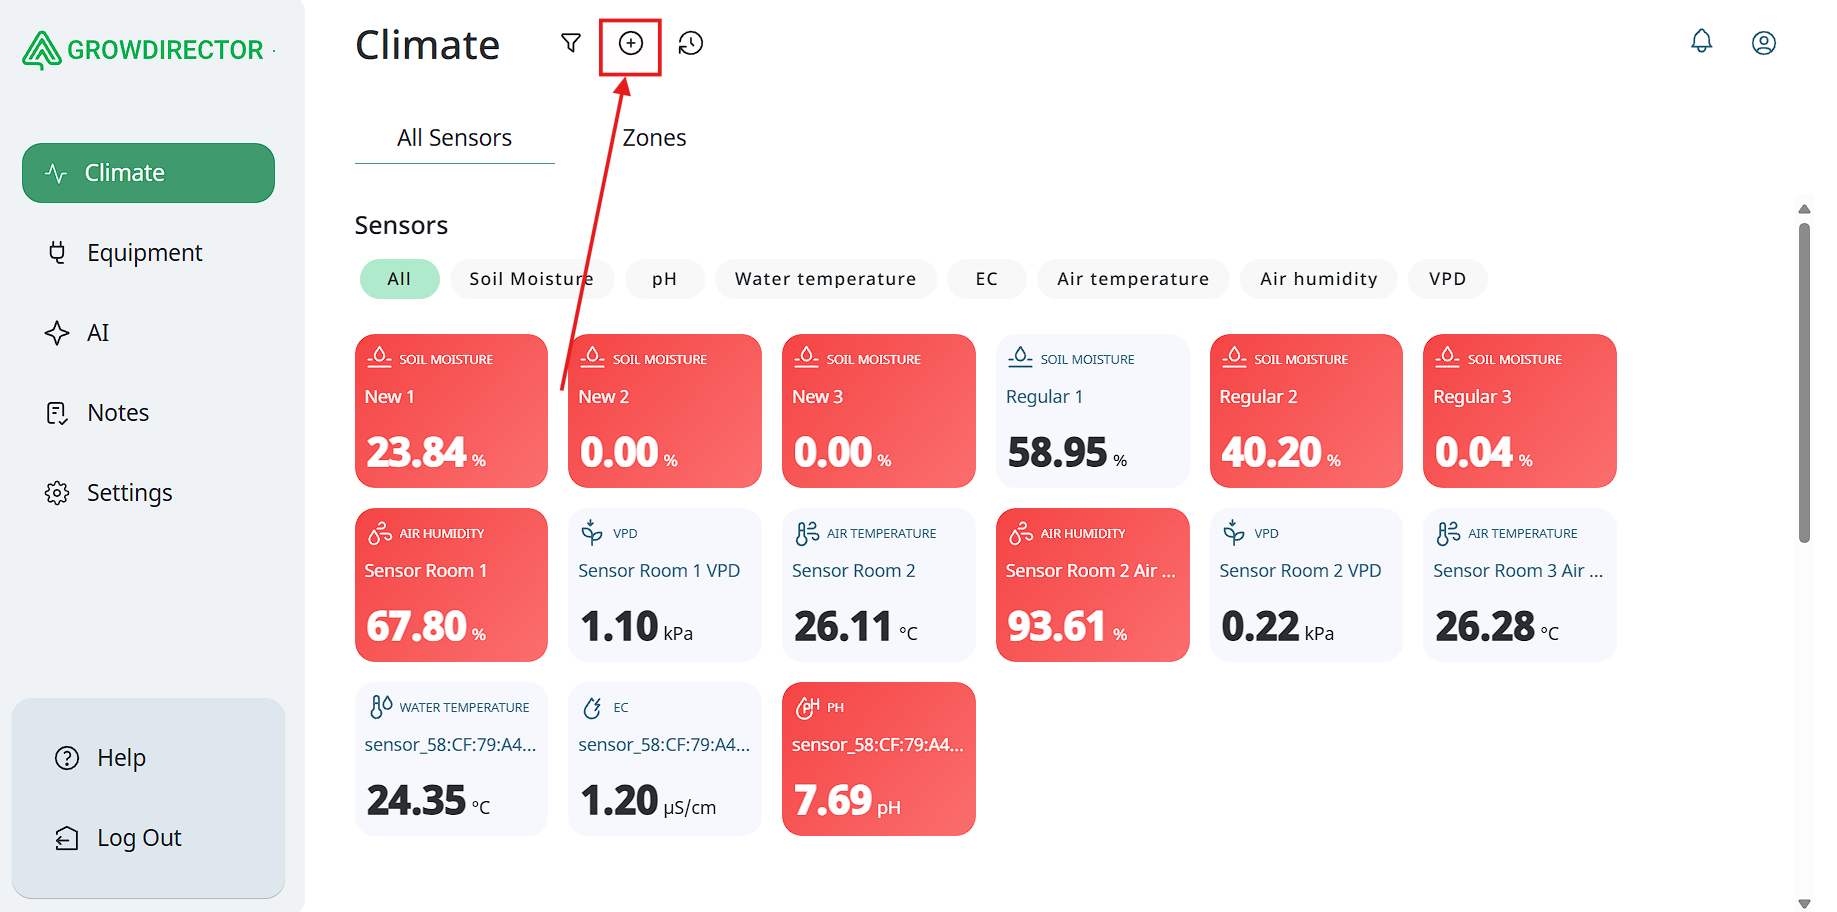
- Add Sensor:
Opens a form or dialog window where users can input details to register and configure a new sensor in the system.
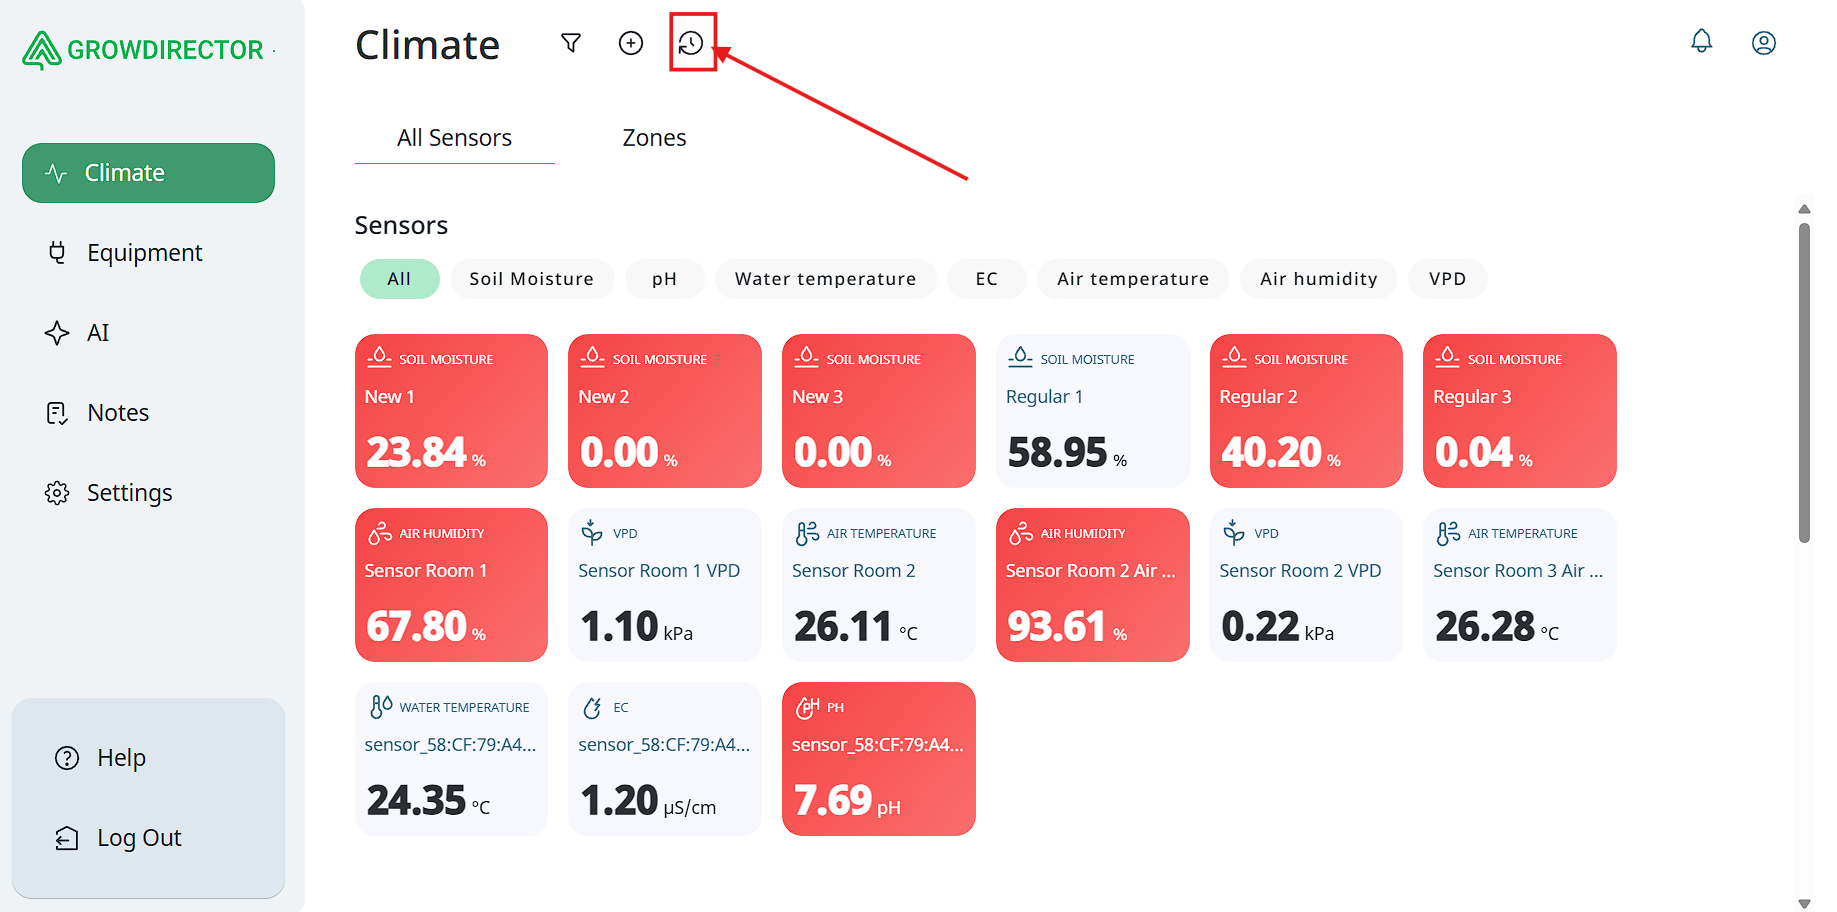
- History:
Provides access to historical sensor data, including time-based trends and archived measurements. This feature supports data analysis over selected time ranges for diagnostics and reporting.
These controls are designed to provide users with flexible tools for interacting with the system’s environmental monitoring features.
Filter

Add new sensor
Sensor history
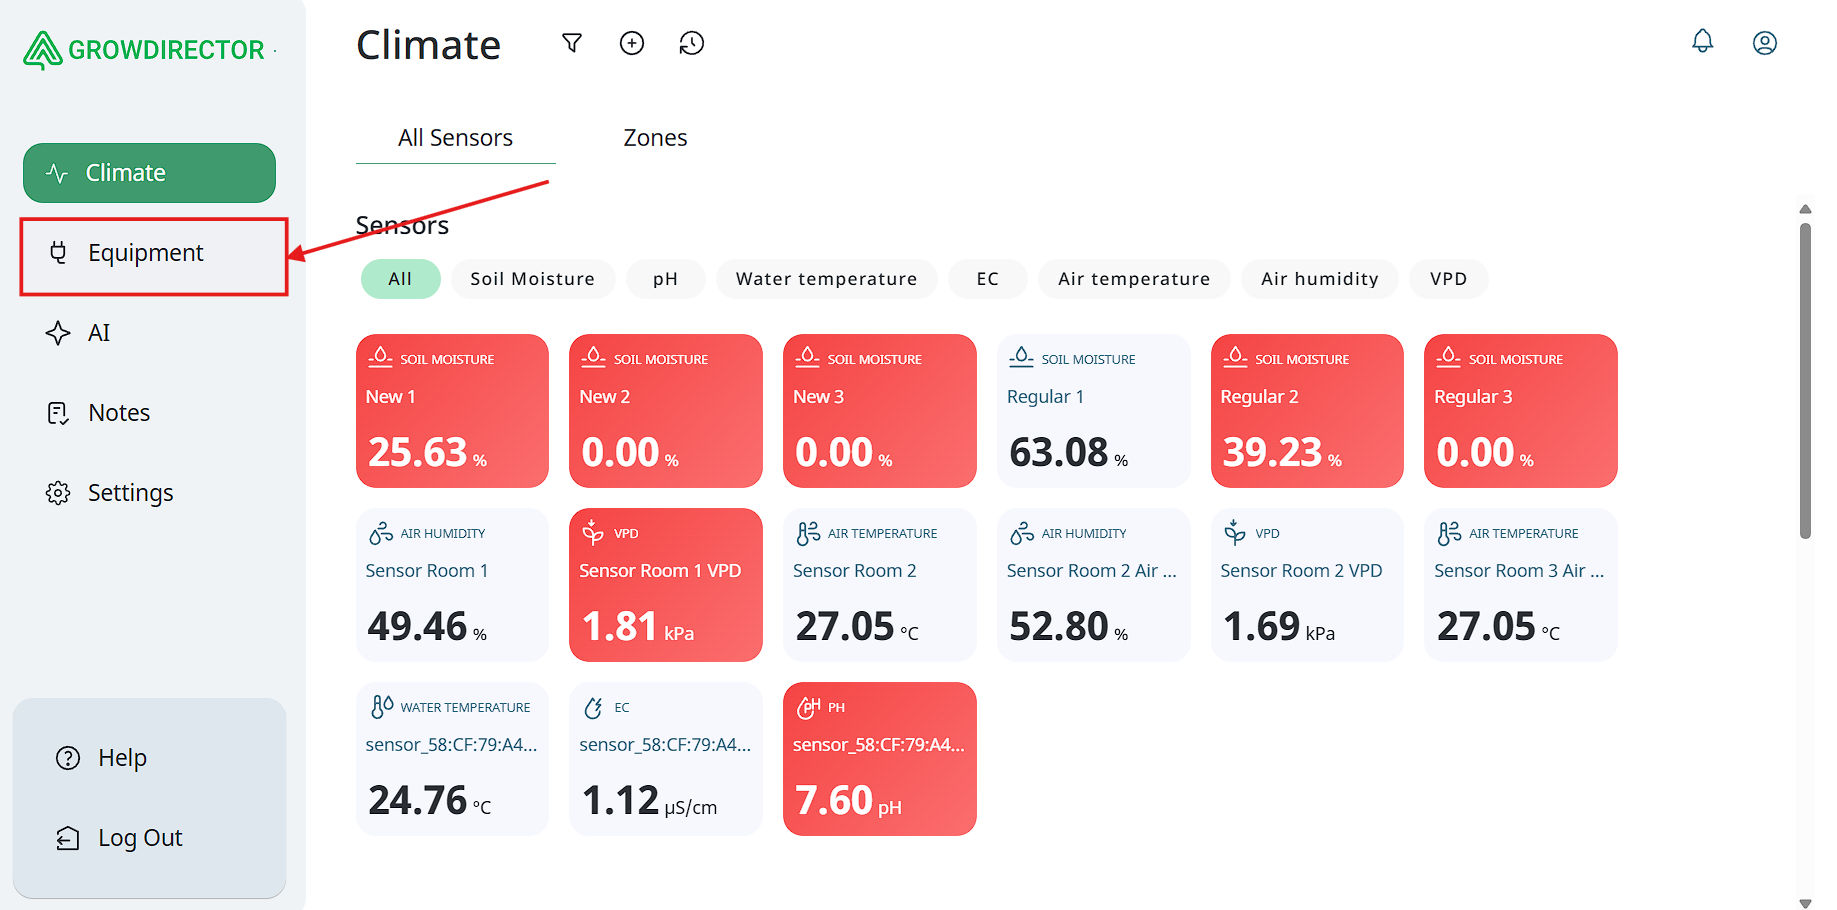
Equipment
The next tab in the left-hand navigation menu is Equipment.
When this tab is selected, the right-hand panel updates to display a dedicated interface for equipment management.
This interface contains two sub-tabs:
- Modules:
Displays a list of all system modules, types and names of modules.
- Devices:
Lists all connected devices, providing information such as device type and identifier.
This section allows users to manage the physical components of the system in a structured and accessible way.
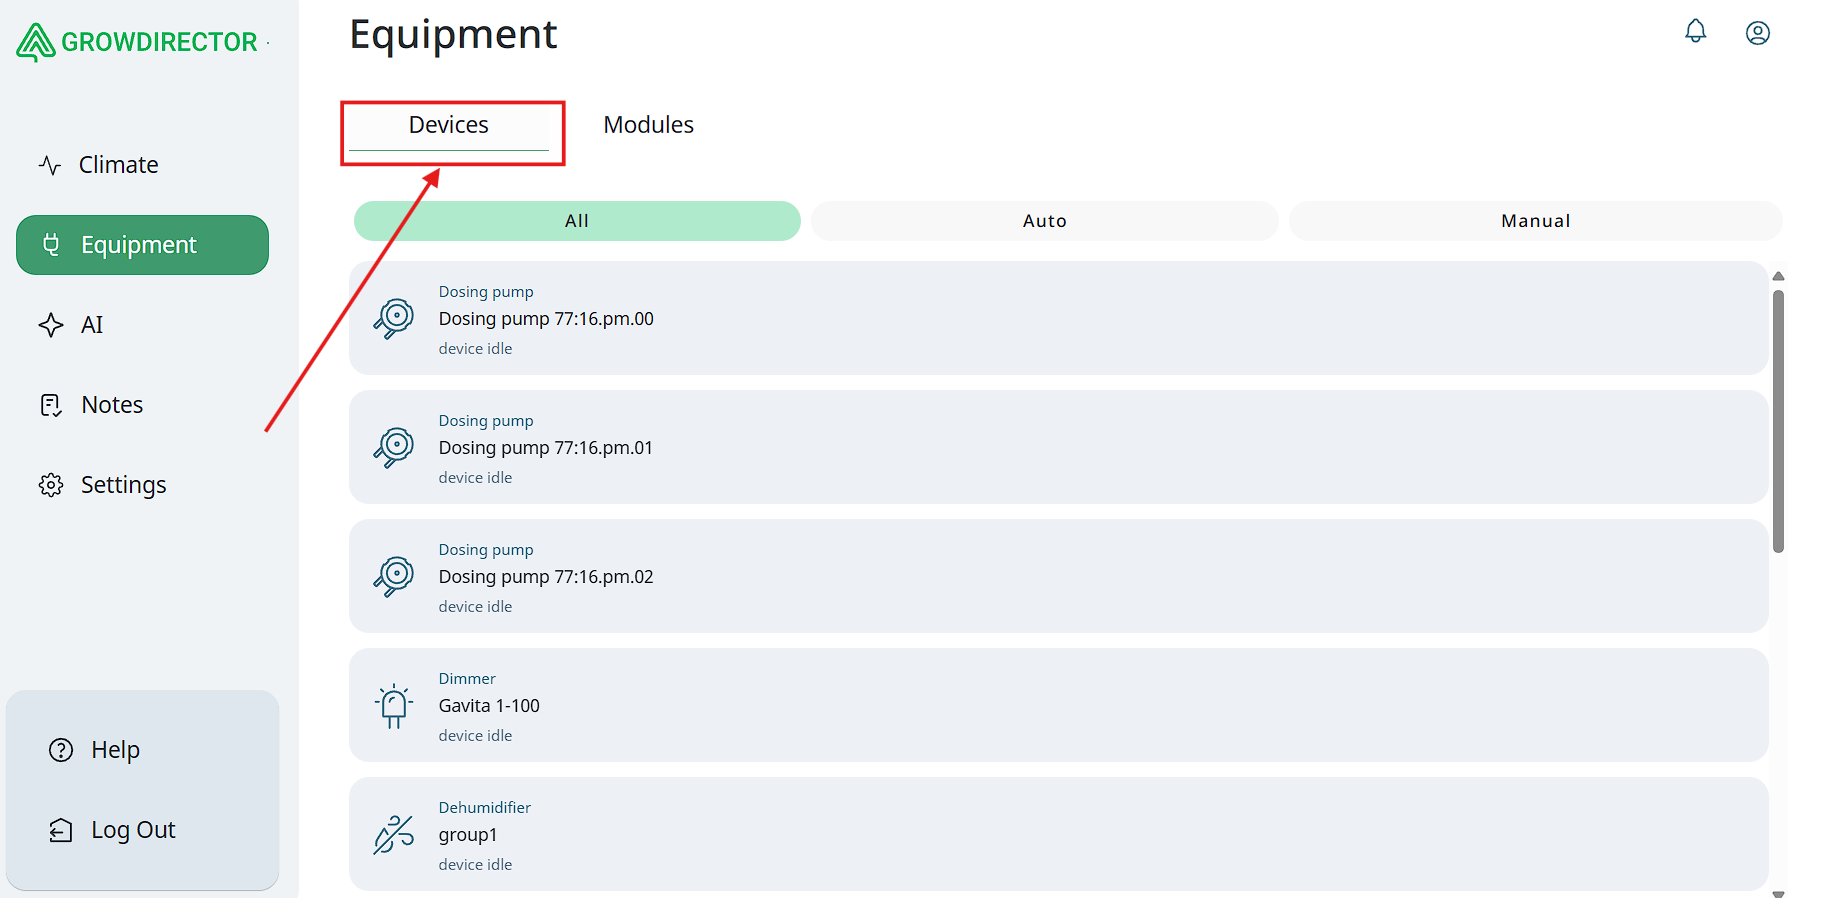
Devices
The Devices tab provides an overview of all devices that have been added to the system.
- Device List:
By default, all devices are displayed in a single list, showing their names, statuses, and associated modules or zones.
- Filtering Options:
At the top of the screen, a filtering panel allows users to narrow down the device list based on operational mode.
Available filter options include:
-
All Devices (default view);
-
Auto Mode: Displays only devices currently operating in automatic mode;
-
Manual Control: Displays devices that can be controlled manually.
These filtering tools enable users to quickly locate and manage devices according to their current configuration and control mode.
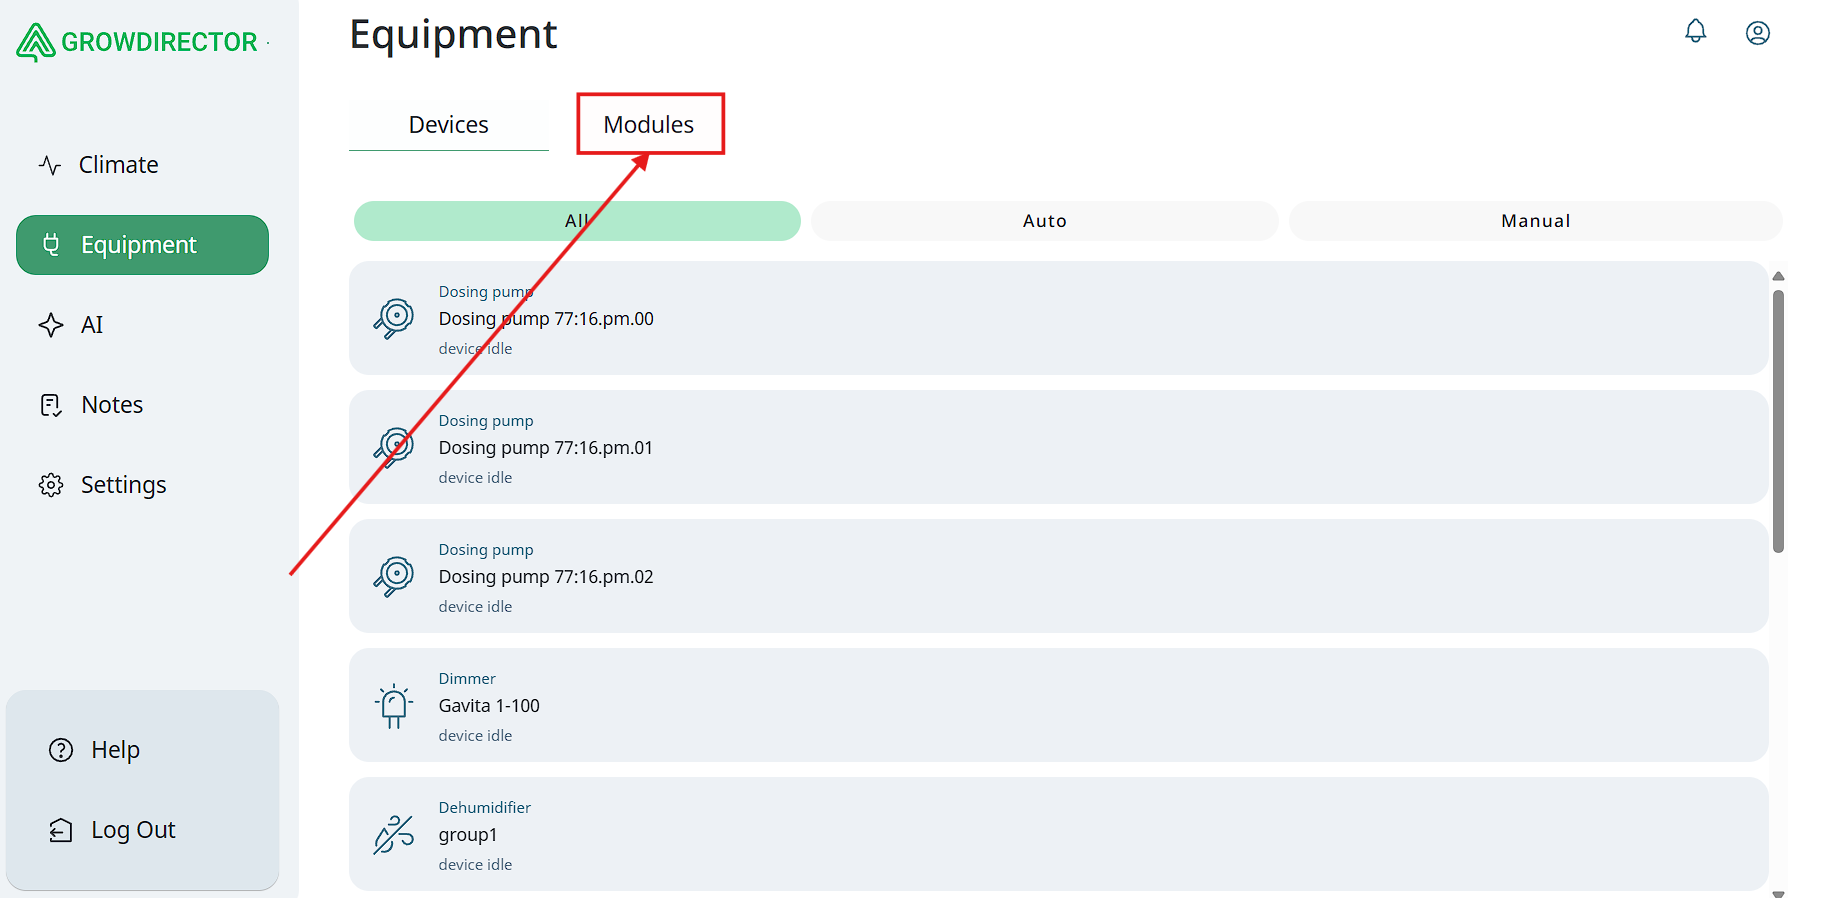
Modules
The Modules tab displays a complete list of all modules currently added to the system.
For each module, the following information is shown:
-
Module Name: The user-defined or system-assigned name for easy identification.
-
Module Type: Indicates the functional type of the module (DryContactDirector, SensorDurector, HydroDirector, etc).
This view provides a centralized overview of all modules for quick reference and management.
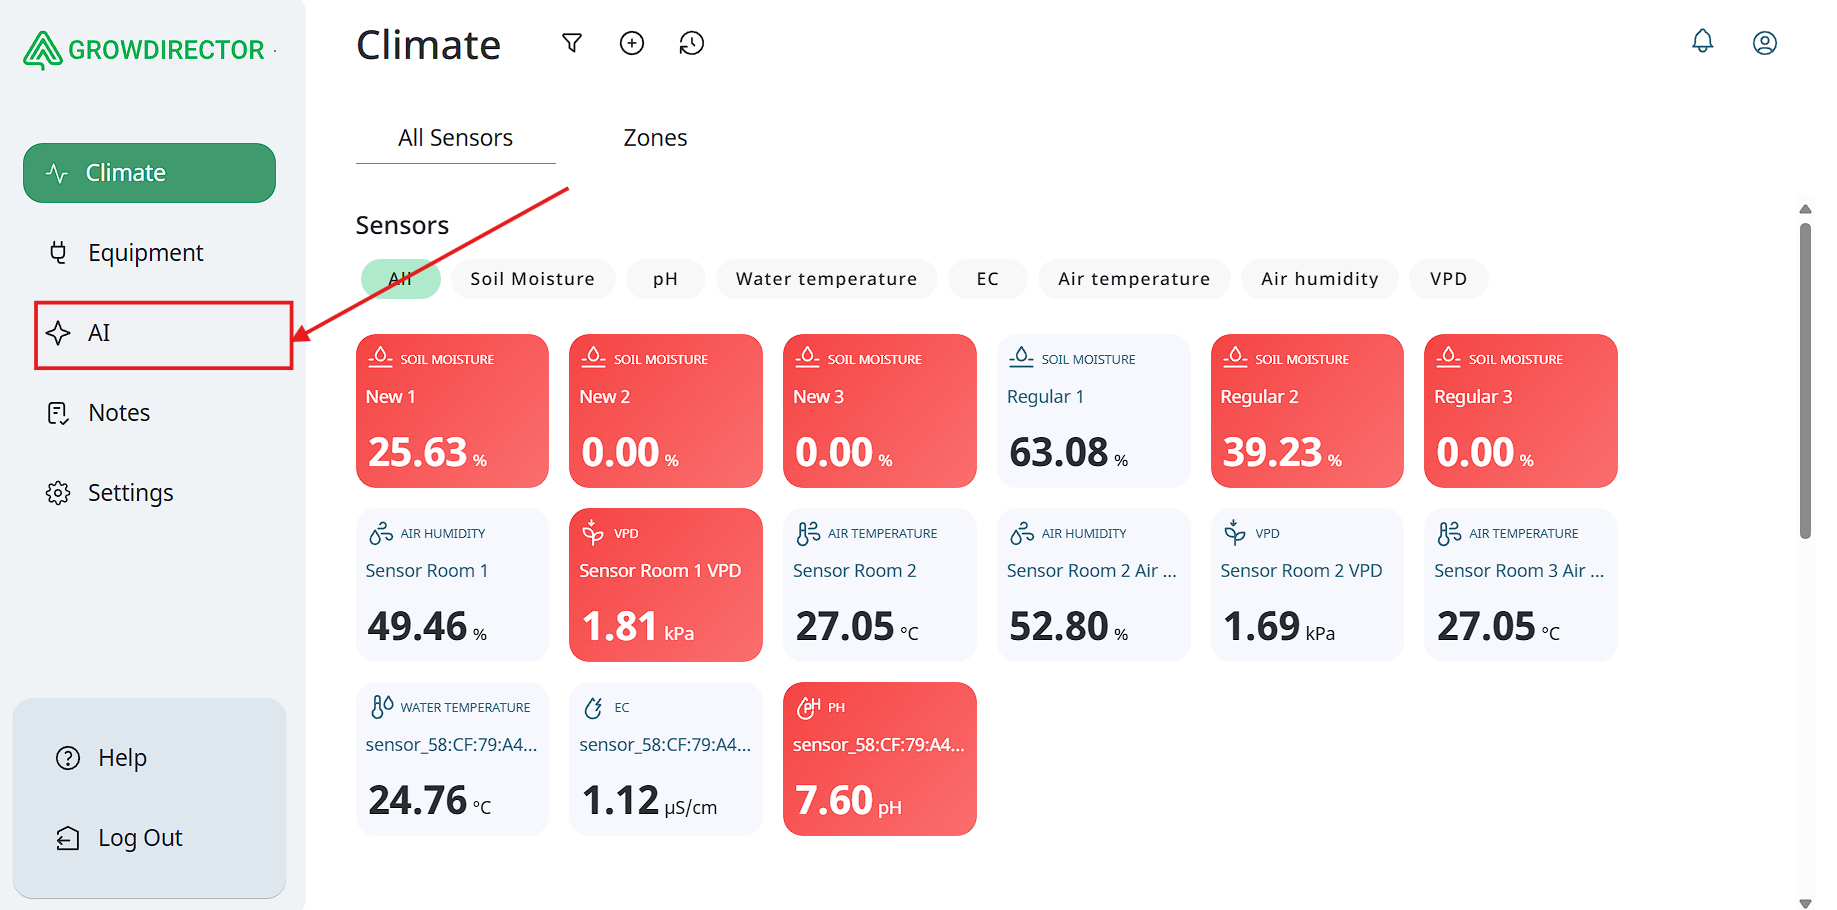
AI
The next tab in the left-hand navigation panel is AI.
This section provides access to three distinct AI tools, each serving a specific purpose:
- AI Summary:
Opens a dashboard view that provides a summarized overview of system activity, sensor data, and key performance indicators for quick analysis.
- AI Agronomist:
An intelligent assistant designed to answer questions related to plant cultivation, crop health, and best agricultural practices. Users can ask about specific issues and receive tailored advice.
- AI Support:
Provides assistance with the application and connected hardware. This AI tool helps troubleshoot issues and offers guidance on setup, configuration, and common problems.
These AI tools are integrated to enhance usability, decision-making, and support within the system.
Notes
Agrinotes is a chapter within the GrowDirector App that integrates grower sensor data from our devices and provides basic ERP functionality for growers. Key features include:
-
Integrated Pest Management (IPM) System: Helps monitor and manage pests, with future AI-based image recognition via the AI Agronomist (planned for later stages, not MVP).
-
Crop Rotation Planning: Assists in planning optimal crop sequences to enhance soil health and productivity.
-
Task Management: Supports labor scheduling, task assignment, and productivity tracking.
-
Advanced Analytics and Reporting: Offers detailed reports on crop performance, labor productivity, and other operational metrics to support data-driven decisions.
-
Equipment Maintenance Scheduling: Tracks equipment usage and schedules preventive maintenance.
-
Crop Variety Selection: Recommends best crop varieties based on local climate and soil conditions.
-
Future Features (Not MVP):
-
Yield prediction using historical data and environmental conditions.
-
Training software providing educational content on crop and greenhouse management.

Settings
The Settings tab, located in the left-hand navigation menu, serves as the central hub for managing user preferences, account details, notifications, and system configurations. It includes the following key sections:
- Notification Center:
Allows users to view, manage, and customize system notifications and alerts related to device status, sensor readings, and operational events. Users can set preferences for notification types.
- Account:
Provides access to user account settings, including profile information, password management, mail management, demo account and deleting profile.
- Settings:
Contains various configurable system options, including language preferences, units and daylight hours.
- Help:
Offers access to support resources such as FAQs, user guides, troubleshooting tips, and contact information for technical assistance.
- Dashboard:
Allows users to customize and configure the main dashboard layout, including which widgets and data summaries are displayed for quick overview.
- About:
Displays application version information, official link and firmware version.
- Log out:
Enables users to securely log out from the application, ensuring session termination and data protection.
This comprehensive Settings section ensures users have full control over their application environment, support access, and account security.

Help
Users can also quickly access the Help section via a dedicated button located at the bottom of the left-hand sidebar menu. This provides immediate entry to support resources, including FAQs, troubleshooting guides, and contact options for technical assistance, ensuring users can easily find help whenever needed.

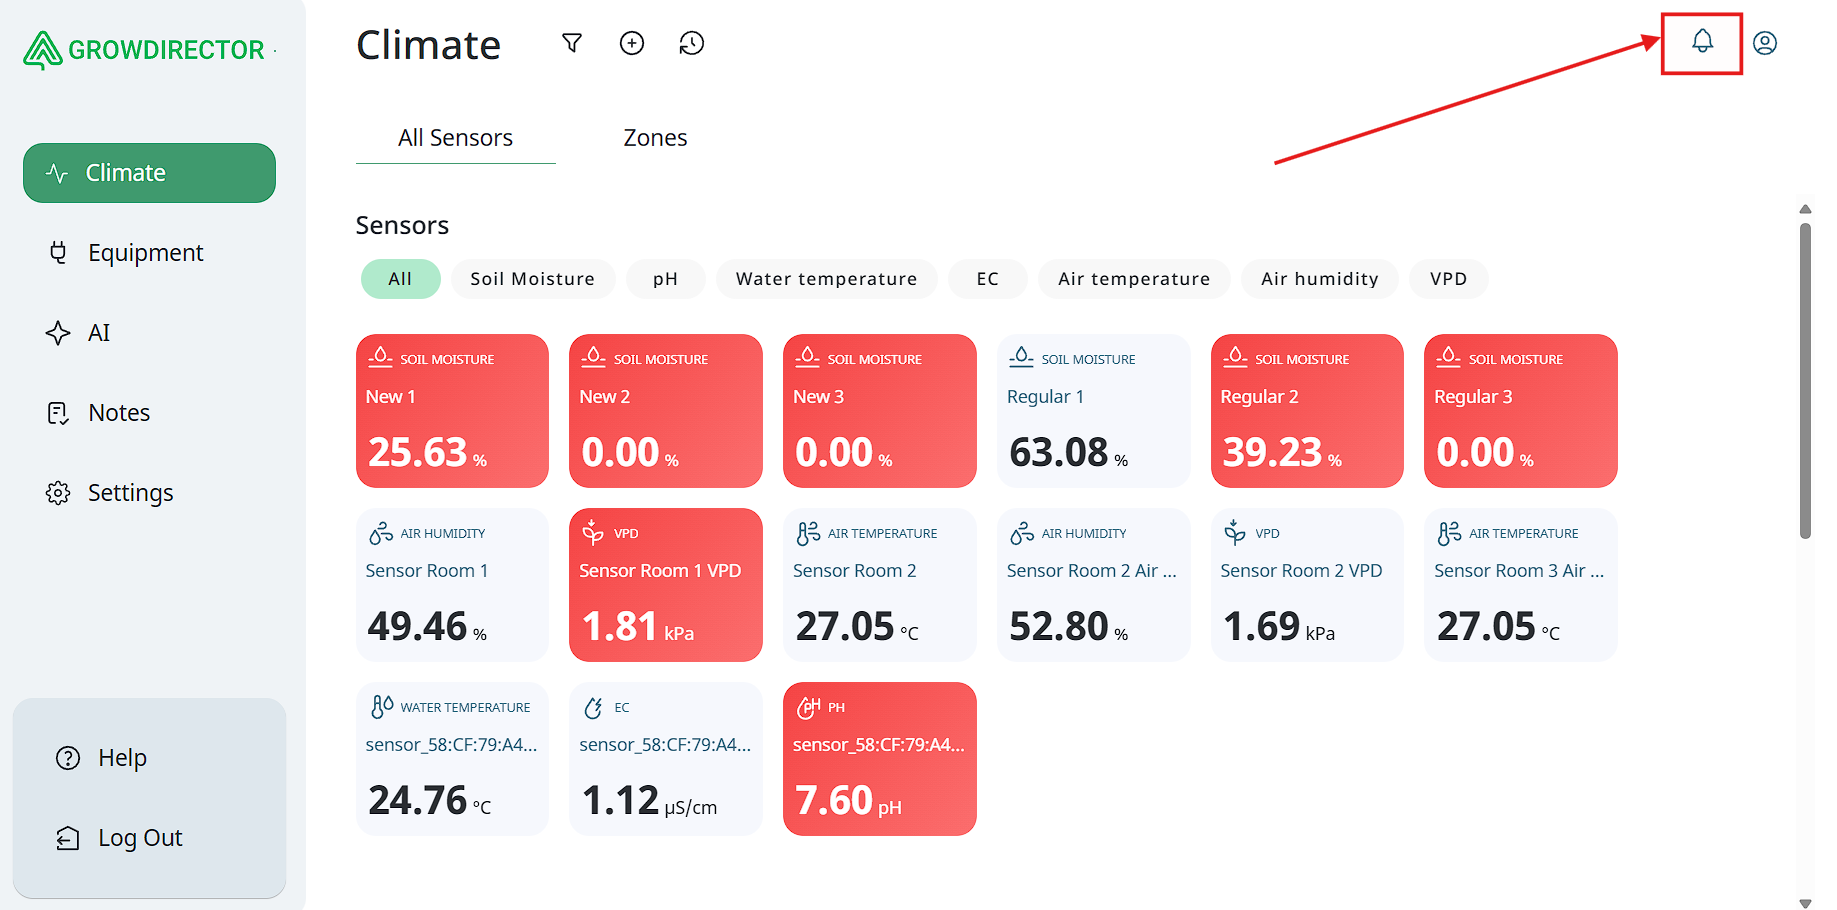
Notification Center
Users can quickly access the Notification Center via a dedicated button located in the top-right corner of the interface. This provides immediate visibility of system alerts, messages, and updates, allowing users to stay informed about important events and device statuses in real time.